Module 3 (Part I) Network Visualization
As we progress into Module 3 of this course, we are introduced to Network, Network Visualization, and Network Properties. Network is a social structure made up of entities and relationships, which are represented as vertices and edges respectively, on a large social network graph. We want to learn about the network because it allows us to study complex relationships, whether it is the spreading of a disease, the propagation from a Reddit article, or the relationship between purchasers or a product. A network can be represented as a directed network or undirected network. By using Network Visualization, we are able to better understand the patterns of interaction and there are many network layouts including Force Directed Layout, Geographic Layout, Clustering Layout, and etc, which can be used for different scenarios depending on what the end-user is looking to analyze.

There are many network properties that can be used to interpret the structure of social networks. Degree centrality measures a node's connectedness and differs between an undirected and directed network. For directed networks, there is an in-degree centrality and out-degree centrality. Betweenness centrality can be used to understand how likely a node will be in the communication paths between other nodes. Closeness centrality describes how long it would take for one node to reach all the other nodes. A major question can be asked such as how long would it take until this H5N1 disease carrier spread the disease in the network? Other network properties include Eigenvector Centrality, reciprocity, clustering, distances, connected component, and etc. Each of these network properties can contribute to better analyze the information from social networks to get better meaning and make important decisions.
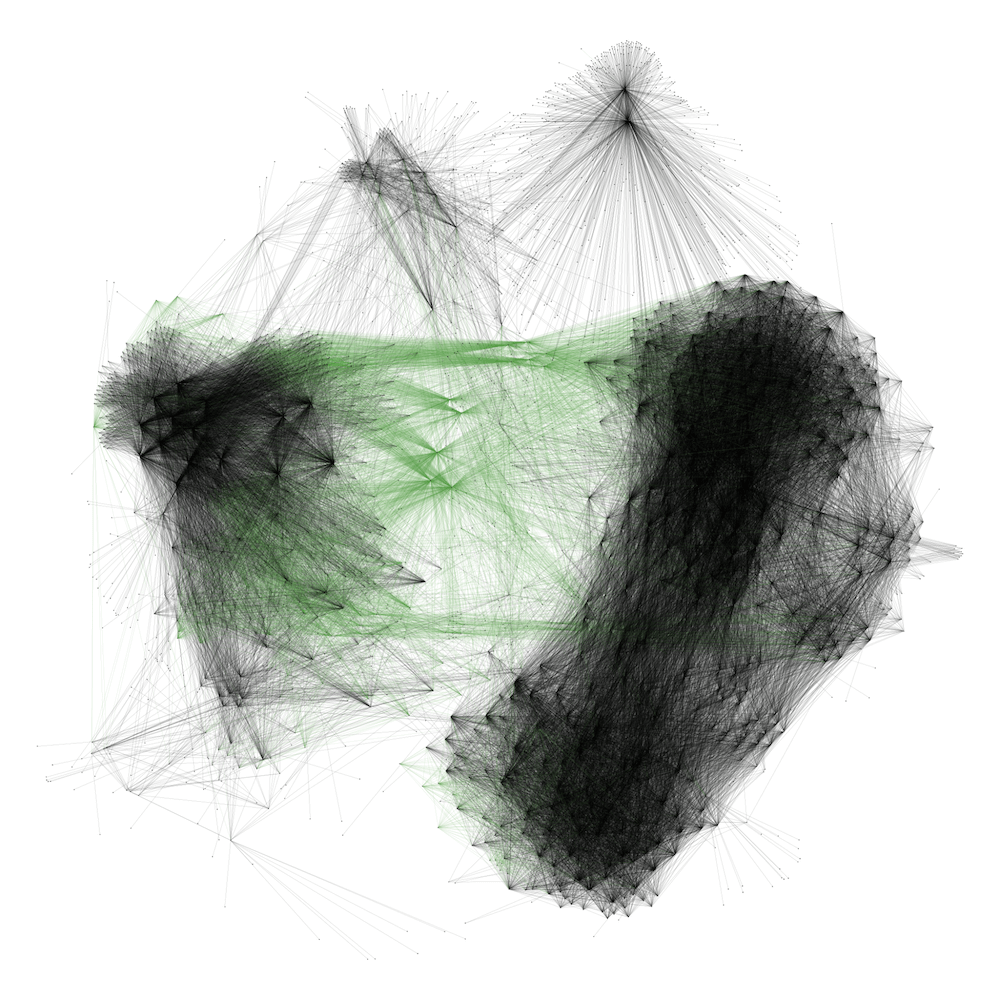
I personally find this week's topic very interesting. Many properties of the network including betweenness centrality and closeness centrality, reminds me of the Kmeans clustering method for unsupervised machine learning. It makes sense because Kmeans is looking for specific clusters of nodes that are more related to one another. It's always fascinating to be able to visualize a whole bunch of nodes and zoom in to better understand some relationships between them. One successful example of using network analysis is to find bots among a large set of Twitter data, that's actively spreading a cryptocurrency giveaway scam. With the combination of the amount of data we have in terms of big data, plus the ability to visualize and analyze network structures, there are unlimited possibilities for us, as data specialists and scientists, to find patterns and relationships between all aspects around us.
References
Anise, Olabode. Mapping Social Networks With Gelphi. Retrieved from https://duo.com/blog/mapping-social-networks-with-gephi.
There are many network properties that can be used to interpret the structure of social networks. Degree centrality measures a node's connectedness and differs between an undirected and directed network. For directed networks, there is an in-degree centrality and out-degree centrality. Betweenness centrality can be used to understand how likely a node will be in the communication paths between other nodes. Closeness centrality describes how long it would take for one node to reach all the other nodes. A major question can be asked such as how long would it take until this H5N1 disease carrier spread the disease in the network? Other network properties include Eigenvector Centrality, reciprocity, clustering, distances, connected component, and etc. Each of these network properties can contribute to better analyze the information from social networks to get better meaning and make important decisions.
I personally find this week's topic very interesting. Many properties of the network including betweenness centrality and closeness centrality, reminds me of the Kmeans clustering method for unsupervised machine learning. It makes sense because Kmeans is looking for specific clusters of nodes that are more related to one another. It's always fascinating to be able to visualize a whole bunch of nodes and zoom in to better understand some relationships between them. One successful example of using network analysis is to find bots among a large set of Twitter data, that's actively spreading a cryptocurrency giveaway scam. With the combination of the amount of data we have in terms of big data, plus the ability to visualize and analyze network structures, there are unlimited possibilities for us, as data specialists and scientists, to find patterns and relationships between all aspects around us.
References
Anise, Olabode. Mapping Social Networks With Gelphi. Retrieved from https://duo.com/blog/mapping-social-networks-with-gephi.


Hi Aileen, agreed, many network layouts can be useful to visualize different patterns of interaction. And when I got into the details about all these graphical representations of network, I also thought about K-Means clustering that we learned in the Data Mining class. Also, it's good to know about one more example of network analysis to find bots among a large set of Twitter data (the graphics look spooky though).
ReplyDeleteWow, the visualization of the spreading of the cryptocurrency giveaway scam actually looks scary... I love it. This is the sort of stuff that really truly is fascinating as a study... so glad we get to learn about this!
ReplyDeleteI liked how you highlighted the different analyses that you can perform using networks. Network analysis can be performed to determine disease progression as you mentioned as well as purchase information. There seems to be limitless possibilities of analysis that can be conducted using networks.
ReplyDelete-Dazmin