Module 3 (Part II) Network Visualization
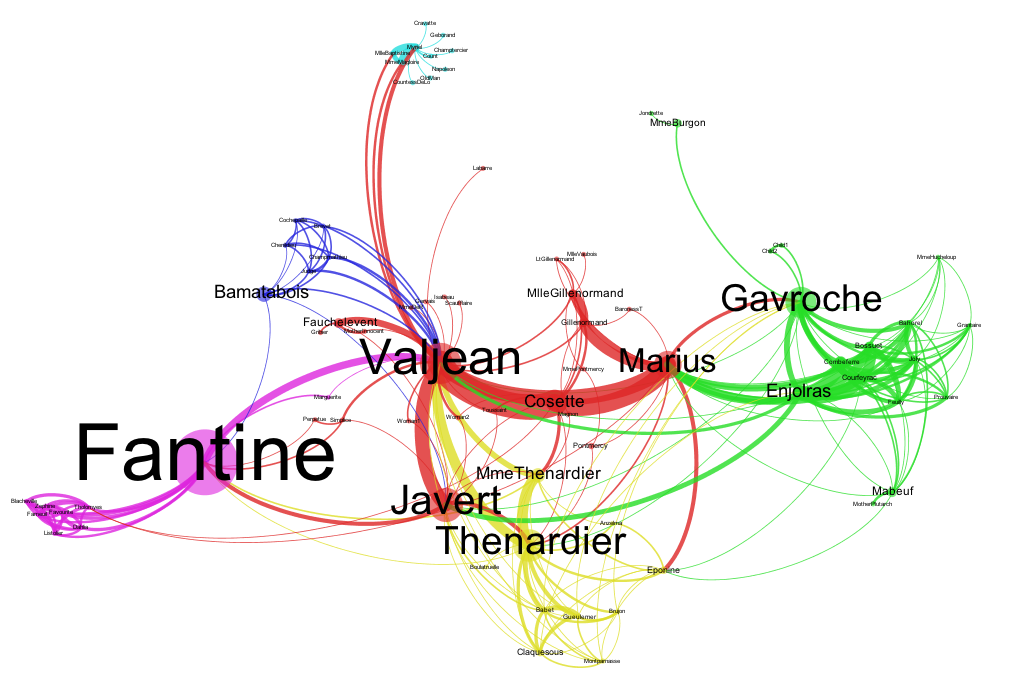
For the last module of this course, we explored Gephi, an open-source network visualization tool to analyze networks. Gephi provides excellent visualization of all the nodes and edges in the network and is also able to quickly calculate the different metrics to get the full picture of the data. We also went over the two different case scenarios using network analysis, the Patent Network Applications between Apple and Google, and the Recipes Network Analysis. By comparing Apple and Google's network of inventors for their patents, one could tell right away from the network visualization that Apple has a more centralized set of core inventors that contribute to most of the patents while Google has a more decentralized approach where smaller groups of inventors work together to invent various types of patents. For the Recipes Network, a user has access to a large amount of data regarding the ratings, which ingredients are frequently used together, and as well as substitutes to different ingredients. There are many ways to analyze and better understand this data to make decisions. For example, a healthy vegan restaurant would probably want to use the healthier substitute of an ingredient to attract more customers and get better ratings. Lastly, it is extremely important when conducting a network analysis to look at many different aspects of the data to include not only the network visualization but also the different types of metrics and their distribution, and as well as the community detection and analyzing the various attributes of the dataset.
I personally feel that social network and network analysis is a very interesting topic and it can really be applied on almost anything that has connections with one another, to better understand the core players and their connectivity with others. Examples of using social network analysis include marketing to find out customers that have the most influence, illicit drug networks to understand drug distribution and community groups to find out who is the catalyst for innovation. One article that I ran into which really caught my eye was using Network Analysis to fight crime. Crime in neighborhoods is a continuous major problem and Social Network Analysis has proven to be really impactful in reducing the crime rate of high crime states including Kansas City and Chicago. A social network can be analyzed to identify crime groups and individuals that are most likely going to perform crime together. By stopping the core members of the crime group by offering educational services and warning, it has shown a drastic decrease in the crime rate in some states. This can also be combined with other scientific methods, such as machine learning algorithms, to better understand when and where crime events usually happen, and thus increasing police patrol during that time.
I personally feel that social network and network analysis is a very interesting topic and it can really be applied on almost anything that has connections with one another, to better understand the core players and their connectivity with others. Examples of using social network analysis include marketing to find out customers that have the most influence, illicit drug networks to understand drug distribution and community groups to find out who is the catalyst for innovation. One article that I ran into which really caught my eye was using Network Analysis to fight crime. Crime in neighborhoods is a continuous major problem and Social Network Analysis has proven to be really impactful in reducing the crime rate of high crime states including Kansas City and Chicago. A social network can be analyzed to identify crime groups and individuals that are most likely going to perform crime together. By stopping the core members of the crime group by offering educational services and warning, it has shown a drastic decrease in the crime rate in some states. This can also be combined with other scientific methods, such as machine learning algorithms, to better understand when and where crime events usually happen, and thus increasing police patrol during that time.

References
Daniel, Barta. Fight Crime with Social Network Analysis. Retrieved from https://hackernoon.com/fight-crime-with-social-network-analysis-7a879d4a65ea.
Renando, Chad. Facebook Social Network Analysis with Gephi: MOOC musings on the value of relationships. Retrieved from https://www.sidewaysthoughts.com/blog/2012/10/facebook-social-network-analysis-with-gephi-mooc-musings-on-the-value-of-relationships/.
It is interesting how law enforcement is using networks to analyze crime. Maybe we will see these network images pop up in the crime shows. Fun stuff.
ReplyDeleteHey Aileen, your blog reminds me of my data mining project focused on crimes in Chicago (dataset source - Kaggle). It was one of the interesting projects to work on, including the use of different predictive and unpredictive models.
ReplyDeleteThe network analysis on crime reminds me of an episode from the (now) old show, Numb3rs, where the genius mathematician was able to identify which members of a crime organization that were critical to "remove" in order to unchain the rest of the members. It felt far-fetched watching the actor do it on a chalkboard... but using tools like Gephi makes this a feasible analysis!
ReplyDelete